Lab
Lighthouse-based testing of first screen load performance and custom operations on test and online deployment environments, collecting runtime performance data and outputting recommendations for optimization.
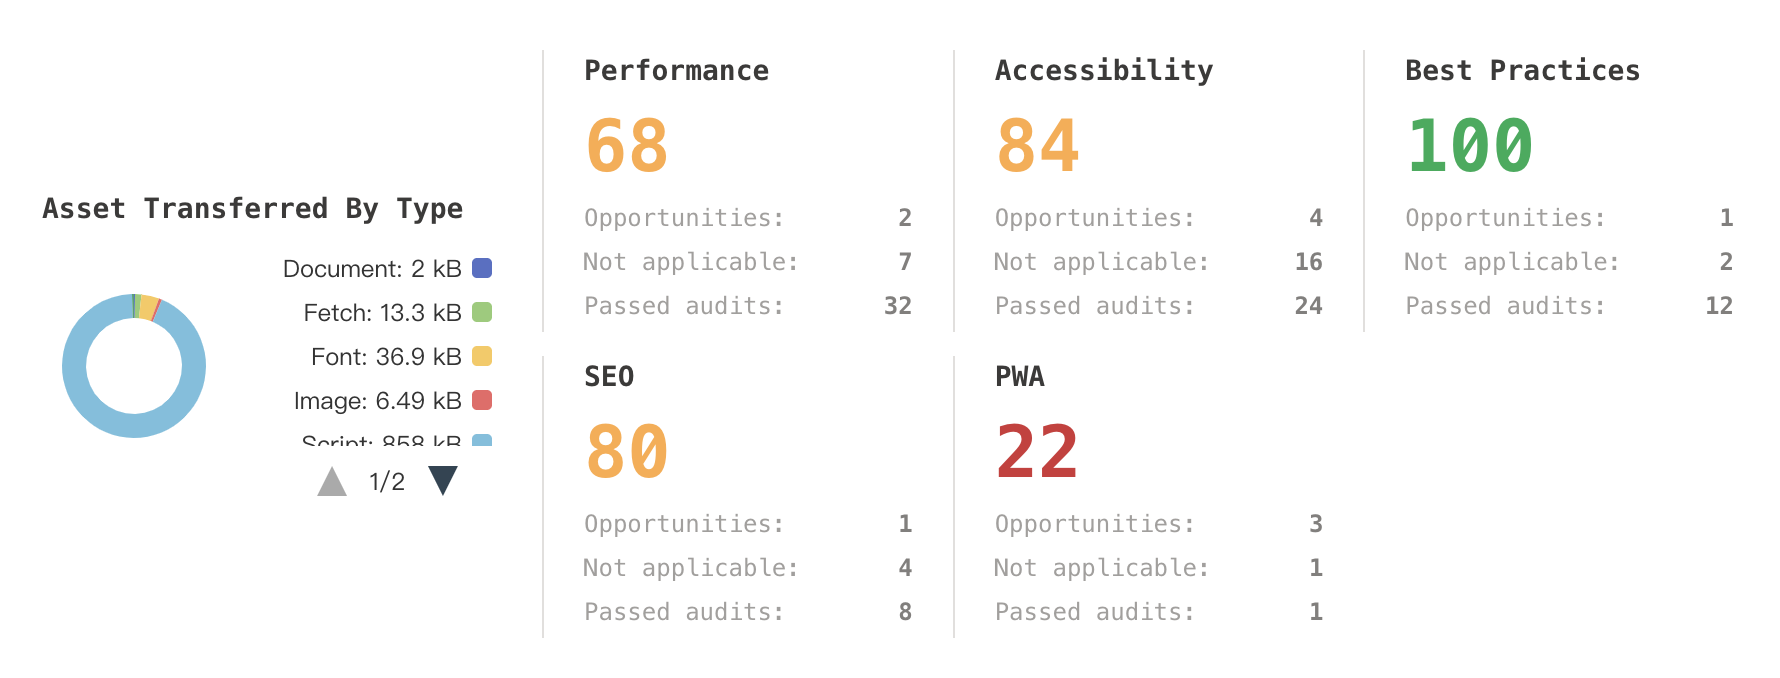
Fully integrated with Lighthouse
Portions of lab report use Lighthouse.
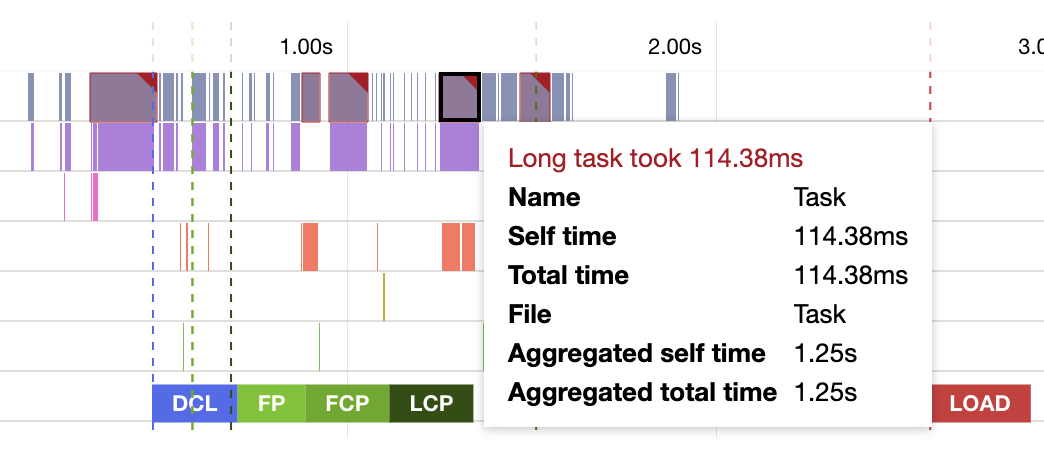
Main Thread Execution Timeline
With the Main Thread Execution Timeline, it’s possible to pinpoint long-running and blocking JavaScript tasks.
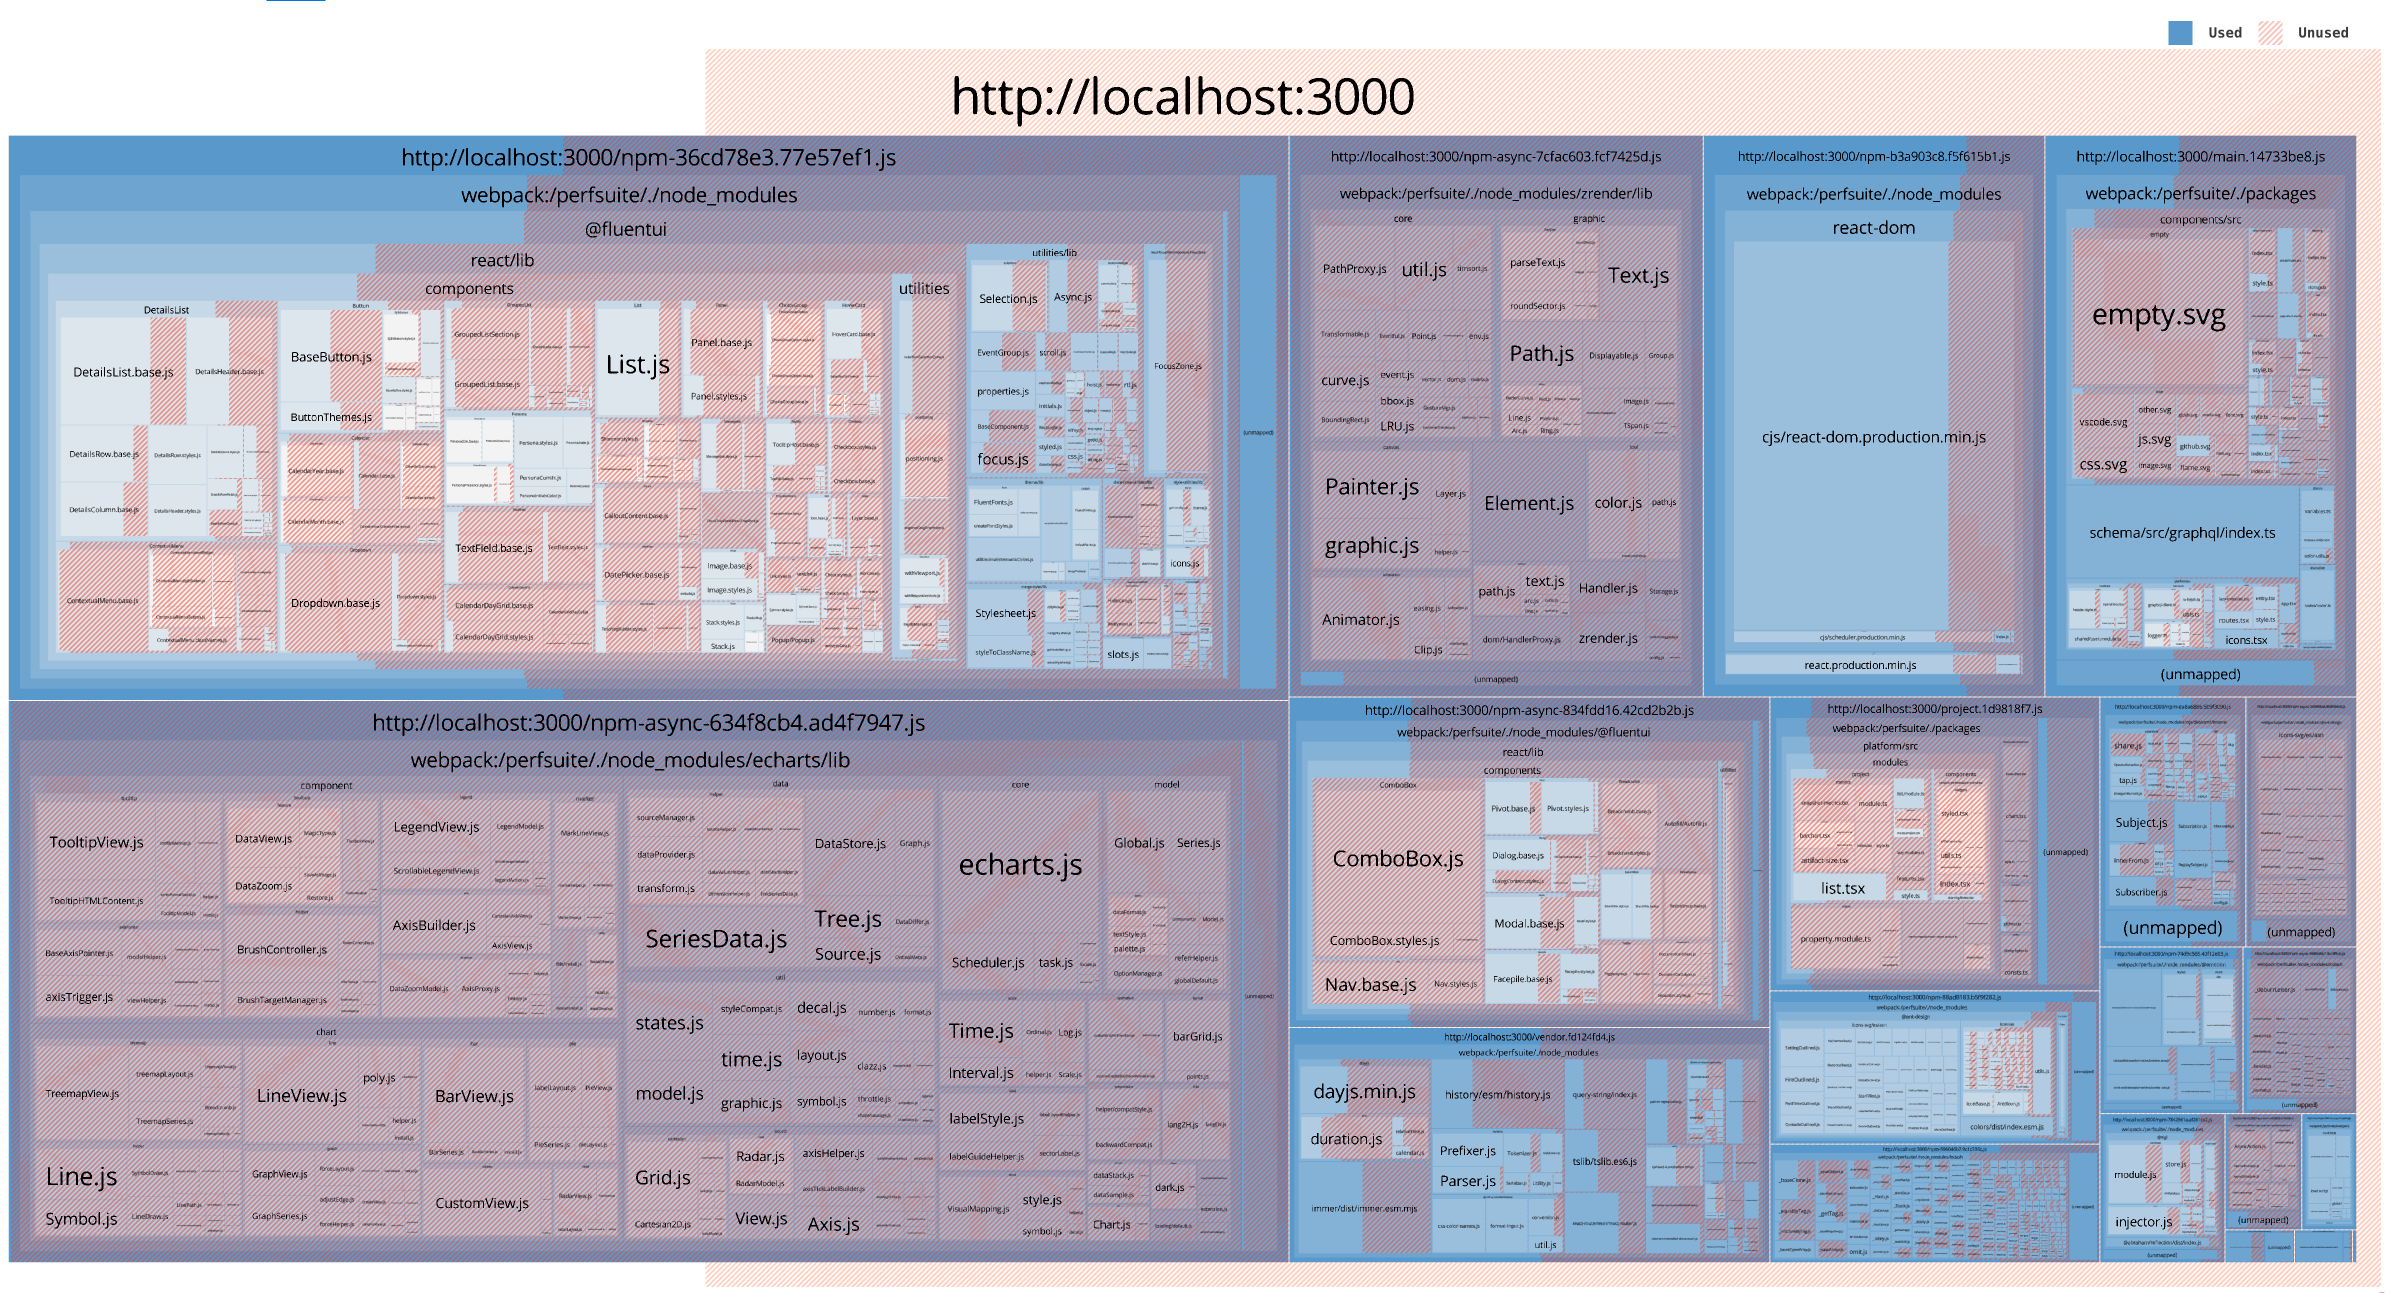
JavaScript code coverage
The visualization shows the JavaScript coverage on the page during runtime. The red shaded parts of the graph are the JavaScript that was downloaded but not run.
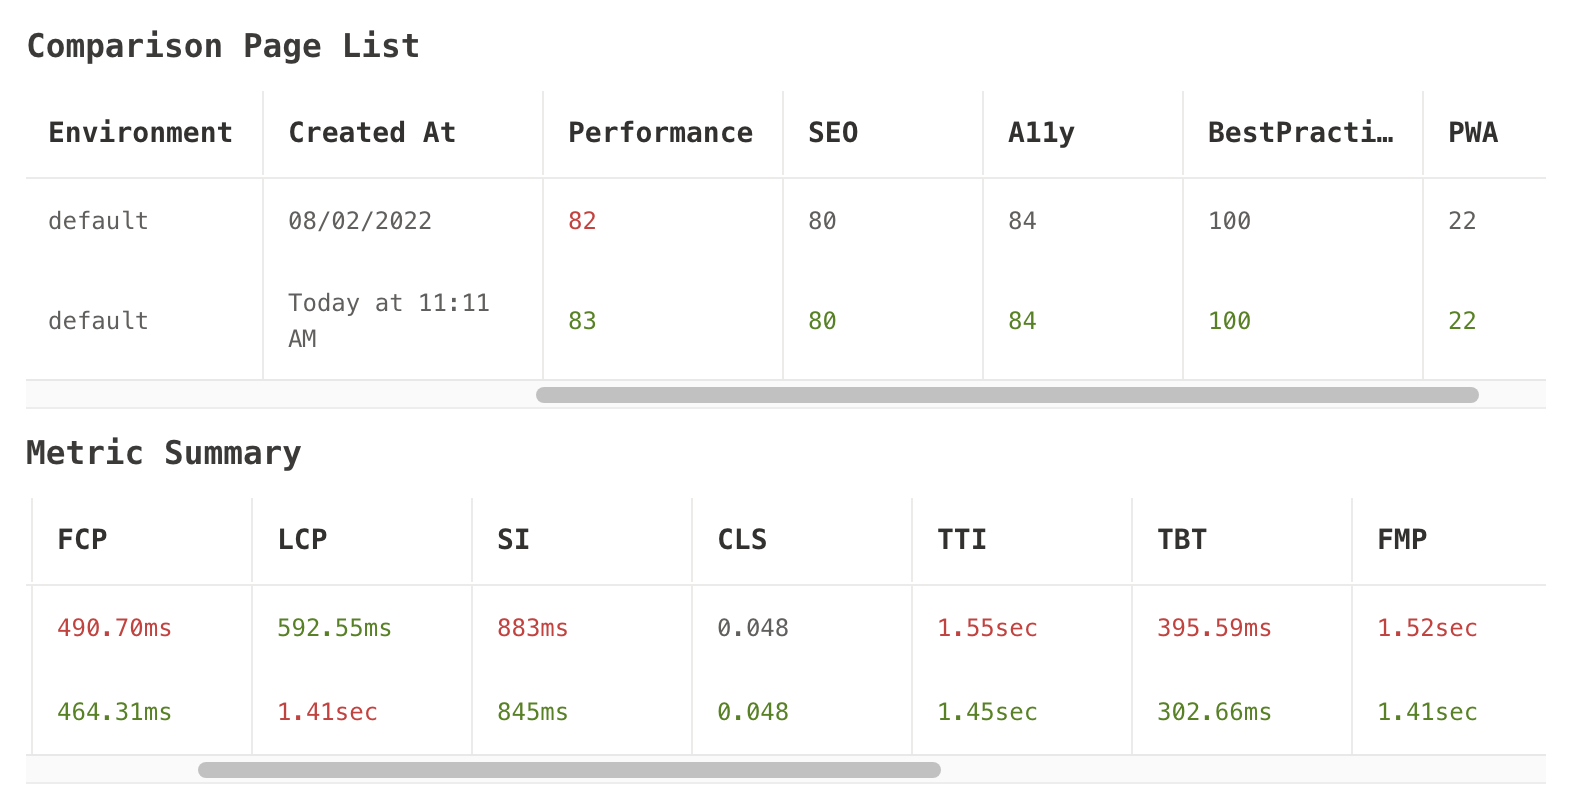
Compare multiple reports
When you want to compare the critical metrics changes of the same page over several time periods, you can select 2 to 5 reports in the list page of Lab.