Source
Based on the function calls collected from runtime analysis, secondary analysis is performed in conjunction with packaged products to further identify code performance bottlenecks and restore the call information to the source level.
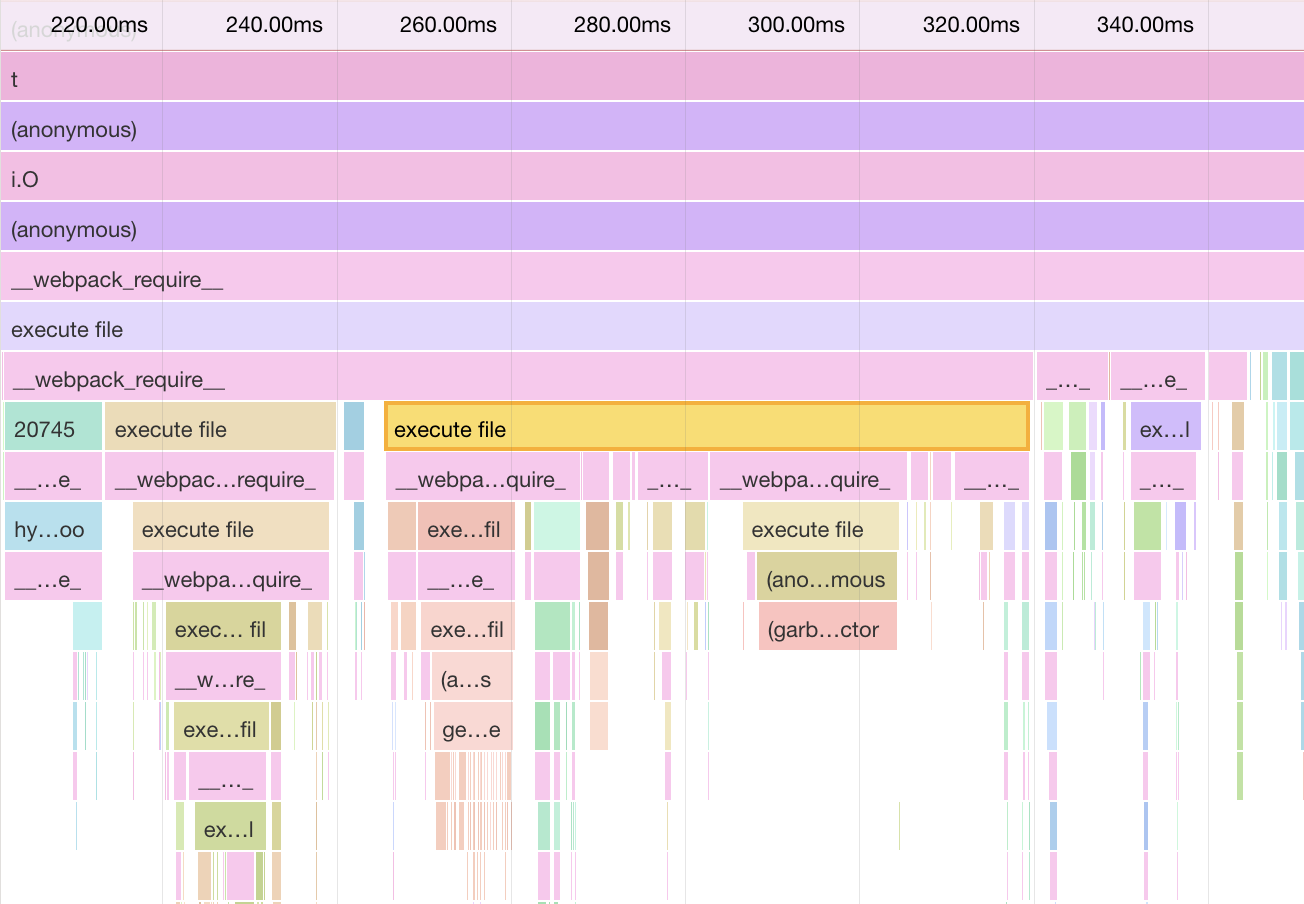
Flamechart
We record the browser profile data and then draw the flame chart to show the real call stack of the page.
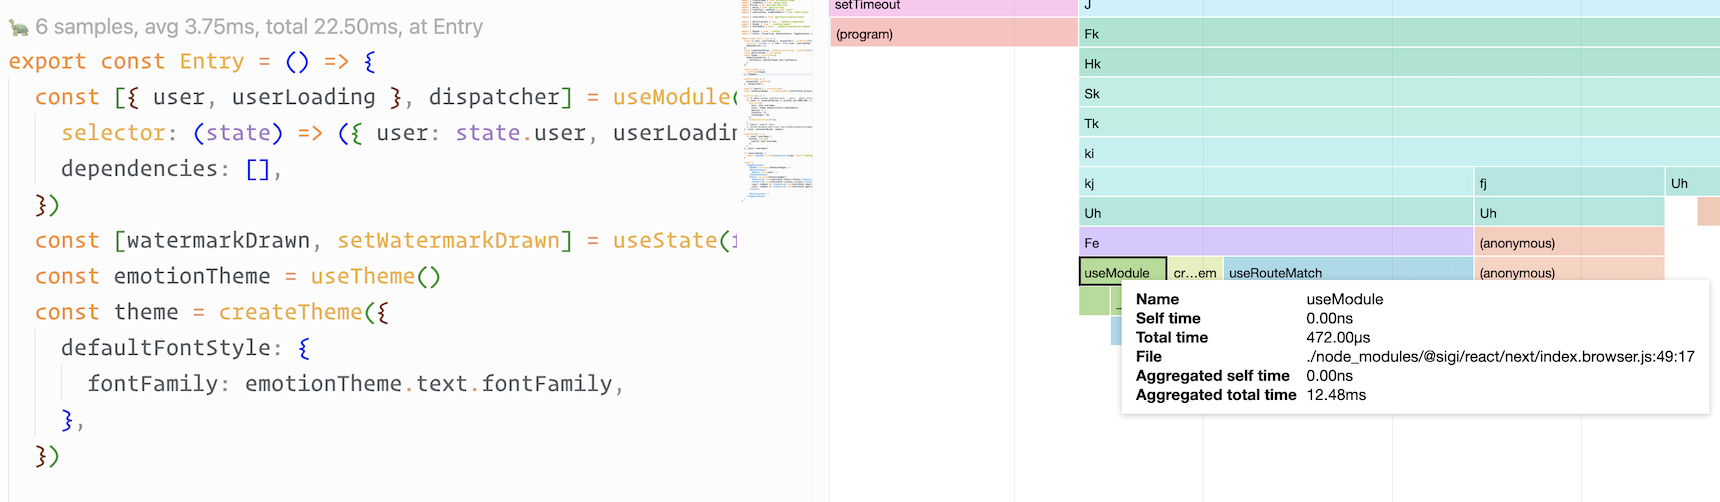
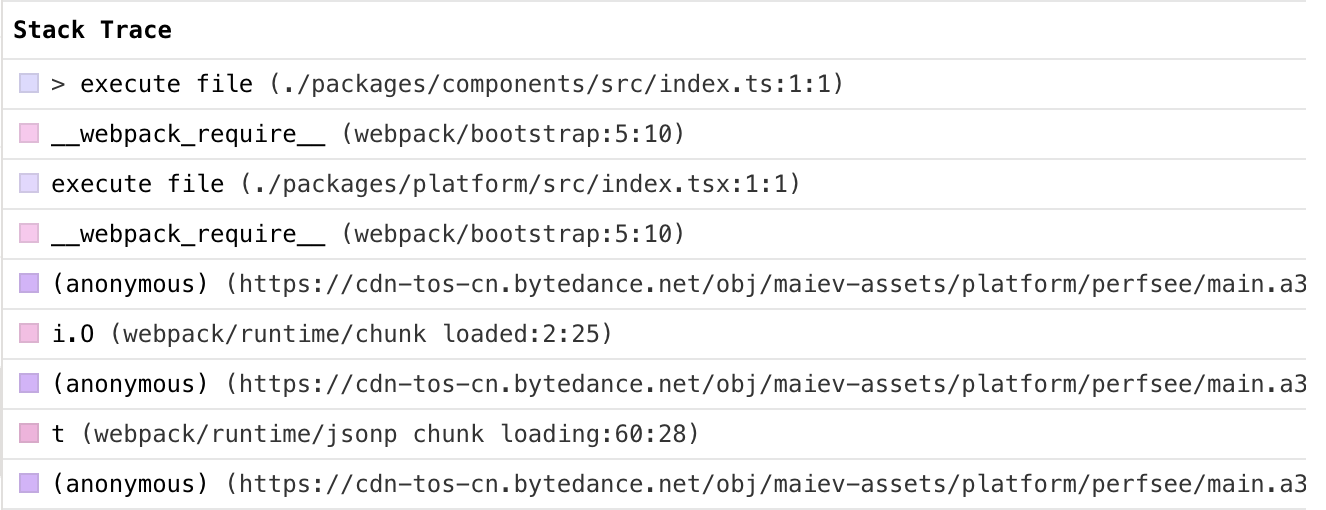
Reductio to real source path
We reductio all the call stack information in the flame chart to the real source paths and function names, to improve the readability of the flame chart and make it easier for developers to understand the call chain
VSCode plugin
Display source report data in VSCode, you can see real function execution time in the inline hint.